

brent
-
Posts
126 -
Joined
-
Last visited
-
Days Won
1
Content Type
Profiles
Forums
Downloads
Articles
Posts posted by brent
-
-
If you are running a webserver, Database, or plex server you might find that your memory is at 90%+ all the time. Here is how to clear it up.
1. create a file at /usr/local/bin. I am calling it free-memory but you can call the file what ever you want.
sudo nano /usr/local/bin/free-memory3. add the command then save and close.
free -h && sudo sysctl -w vm.drop_caches=3 && sudo sync && echo 3 | sudo tee /proc/sys/vm/drop_caches && free -h2. change the permissions of the script.
sudo chmod 555 free-memory4. Creating a cron job.
sudo contrab -e5. I want to run mine every minute. Change this to your needs.
* * * * * /usr/local/bin/free-memory6. check your server after a minute. you should see your memory usage change.
-
Accessing a Gmail Account from Nextcloud
Due to Google's security policies, accessing your Gmail account from Nextcloud requires additional steps.
If you use two factor authentication, you'll need to generate an app password:
- Visit https://myaccount.google.com/apppasswords from a web browser
- At the bottom of the page, click the drop-down box labeled "Select app"
- Choose the option, "Other (Custom name)"
- Enter a descriptive name, such as "Nextcloud Mail"
- Click "Generate"
- Go back to Nextcloud (Mail/Rainloop), and enter your e-mail address and the app password you just generated
-
Your Gmail account should now be accessible from within Nextcloud
If you are not using two factor authentication, you'll need to allow "Less Secure Apps":
- Visit https://myaccount.google.com/lesssecureapps
- Toggle the radio button "Allow less secure apps" to the "ON" position
- Go back to Nextcloud (Mail/Rainloop), and enter your e-mail address and Google password
- Your Gmail account should now be accessible from within Nextcloud
-
The Issue
We want to disable snapd service on system startup/prevent snapd service startup automatically on system boot on Ubuntu or remove Snap completely.
1 Disable snap services
1.1 Bring up the terminal or login via SSH
1.2 Execute following commands to disable snap services
sudo systemctl disable snapd.service
sudo systemctl disable snapd.socket
sudo systemctl disable snapd.seeded
sudo systemctl disable snapd.snap-repair.timer
1.3 Restart the system
sudo reboot1.4 Now the snap service will not start on system startup
2 Removing Snap
To uninstall snap (If necessary), we need to make sure snap is not used at all.If we want to uninstall/remove snap just follow the below steps
2.1 List all snaps
snap list2.2 If there is any installed snap pckage e.g. bashtop, remove all of them one by one
sudo snap remove bashtop2.3 Find the snap core service directory ID
dfFrom the output, under the “Mounted on” column, find the ones with “/snap/core/xxxx”
2.4 Unmount the snap core service
sudo umount /snap/core/xxxx2.5 Remove all snapd package
sudo apt purge snapd2.6 Remove all directories (If necessary), be careful with the rm command, we will lose data if done incorrectly
rm -rf ~/snap sudo rm -rf /snap sudo rm -rf /var/snap sudo rm -rf /var/lib/snapd -
1: Set your user as the owner
chown -R joe /var/www/your-website.com/This command sets joe as the owner of every file and folder inside the directory (-R stands for recursive).
2: set the web server as the group owner
chgrp -R www-data /var/www/your-website.com/This command sets www-data as the group owner of every file and folder inside the directory. Recursive mode, as above.
3: 750 permissions for everything
chmod -R 750 /var/www/your-website.com/The third command sets the permissions: read, write and execute (7) for the owner (i.e, you), read and execute (5) for the group owner (i.e, the web server0, zero permissions at all (0) for others. Once again this is done on every file and folder in the directory, recursively.
4: new files and folder inherit group ownership from parent folder
chmod g+s /var/www/your-website.com/The last command makes all files/folders created within the directory to automatically take on the group ownership of the parent folder, that is your web server. The S flags is a special mode that represents the setuid/setgid. In simple words, new files and directories created by the web server will have the same group ownership of your-website.com/ folder, which we set to www-data with the second command.
When the web server needs to write
If you have folders that need to be writable by the web server, you can just modify the permission values for the group owner so that www-data has write access. Run this command on each writable folder:
chmod g+w /var/www/your-website.com/<writable-folder>
For security reasons apply this only where necessary and not on the whole website directory.
-
APCu
APCu is a data cache, and it is available in most Linux distributions. On Red Hat/CentOS/Fedora systems install
php-pecl-apcu. On Debian/Ubuntu/Mint systems installphp-apcu.After restarting your Web server, add this line to your
config.phpfile:'memcache.local' => '\OC\Memcache\APCu',Refresh your Nextcloud admin page, and the cache warning should disappear.
-
To enable preview for files in nextcloud, you need to install “Preview Generator” from next cloud app store
https://apps.nextcloud.com/apps/previewgenerator
To install login to nextcloud as admin. From right drop down menu, click + Apps link.

Once on Apps page, you can use the search button on right side to search for "Preview Generator" and install it.
You need to install some additional software, on ubuntu/debian install it with
sudo apt install libreoffice ffmpeg imagemagick ghostscriptNow edit config/config.php file of your nextcloud installation, add following code
'enable_previews' => true,
'preview_libreoffice_path' => '/usr/bin/libreoffice',
'enabledPreviewProviders' =>
 array (
    0 => 'OC\\Preview\\TXT',
    1 => 'OC\\Preview\\MarkDown',
    2 => 'OC\\Preview\\OpenDocument',
    3 => 'OC\\Preview\\PDF',
    4 => 'OC\\Preview\\MSOffice2003',
    5 => 'OC\\Preview\\MSOfficeDoc',
    6 => 'OC\\Preview\\PDF',
    7 => 'OC\\Preview\\Image',
    8 => 'OC\\Preview\\Photoshop',
    9 => 'OC\\Preview\\TIFF',
   10 => 'OC\\Preview\\SVG',
   11 => 'OC\\Preview\\Font',
   12 => 'OC\\Preview\\MP3',
   13 => 'OC\\Preview\\Movie',
   14 => 'OC\\Preview\\MKV',
   15 => 'OC\\Preview\\MP4',
   16 => 'OC\\Preview\\AVI',
 ),
For more info on configuration, check nextcloud documenation.
Generate Preview for existing files
Lets generate thumbnail for existing files, for this, I enabled shell access for www-data so preview files have proper file ownership (not owned by root).
chsh --shell /bin/bash www-dataNow change to www-data user
su - www-dataNow run: (Without www-data)
sudo -u www-data php /var/www/cloud.kc-linux.com/html/occ preview:generate-all -vvvor (with switching to www-data user)
/usr/bin/php /var/www/nextcloud/occ preview:generate-all -vvv
Autogenerate Previews for new files
set a cronjob as user www-data
crontab -e -u www-data*/5 * * * * /usr/bin/php /var/www/nextcloud/occ preview:pre-generate > /dev/null 2>&1 -
Letsencrypt Auto Renew Testing:
Though this part is optional but I recommand you to test your auto-renew cron script for errors. It will be a disaster if your Letsencrypt Certificate does not renew before expire due to some error.
Basic Testing using --dry-run:
For error checking we’ll perform
certbot renew --dry-runorpath/location/certbot-auto renew --dry-run——- a process in which the auto-renew script will be executed without actually renewing the certificates.Execute the following lines on your Linux terminal,
sudo -i
certbot renew --dry-run && apache-restart-command
testing using --force-renew
In this advance testing section we’ll simulate the letsencrypt auto certificate renewal process by using –force-renew command. As you already know that the certbot renew command only take action if your certificate has less than 30 days. But if we use it with “–force-renew” command then your certificate get renewed immediately. Remember that, you only can renew 5 certificates per week for a particular domain or subdomain.
Note the date of your current certificate
To view the current expire date of your let’s encrypt certificate, execute the following command on your terminal.
sudo openssl x509 -noout -dates -in /etc/letsencrypt/live/your-domain-name/fullchain.pemCheck if renewal was successful
Now, Lets again check the let’s encrypt certificate’s expire date,
sudo openssl x509 -noout -dates -in /etc/letsencrypt/live/your-domain-name/fullchain.pem -
Node exporter is the best way to collect all the Linux server related metrics and statistics for monitoring.
Monitor Linux Servers Using Prometheus
In this guide, you will learn how to setup Prometheus node exporter on a Linux server to export all node level metrics to the Prometheus server.
Before You Begin
- Prometheus Node Exporter needs Prometheus server to be up and running. If you would like to setup Prometheus, please see the
- Port 9100 opened in server firewall as Prometheus reads metrics on this port.
Setup Node Exporter Binary
Step 1: Download the latest node exporter package. You should check the Prometheus downloads section for the latest version and update this command to get that package.
wget https://github.com/prometheus/node_exporter/releases/download/v1.3.1/node_exporter-1.3.1.linux-amd64.tar.gzStep 2: Unpack the tarball
tar -xvf node_exporter-0.18.1.linux-amd64.tar.gzStep 3: Move the node export binary to /usr/local/bin
sudo mv node_exporter-0.18.1.linux-amd64/node_exporter /usr/local/bin/Create a Custom Node Exporter Service
Step 1: Create a node_exporter user to run the node exporter service.
sudo useradd -rs /bin/false node_exporterStep 2: Create a node_exporter service file under systemd.
sudo vi /etc/systemd/system/node_exporter.serviceStep 3: Add the following service file content to the service file and save it.
[Unit]
Description=Node Exporter
After=network.target

[Service]
User=node_exporter
Group=node_exporter
Type=simple
ExecStart=/usr/local/bin/node_exporter

[Install]
WantedBy=multi-user.target
Step 4: Reload the system daemon and star the node exporter service.
sudo systemctl daemon-reload
sudo systemctl start node_exporter
Step 5: check the node exporter status to make sure it is running in the active state.
sudo systemctl status node_exporterStep 6: Enable the node exporter service to the system startup.
sudo systemctl enable node_exporterNow, node exporter would be exporting metrics on port 9100.
You can see all the server metrics by visiting your server URL on /metrics as shown below.
http://<server-IP>:9100/metrics
Configure the Server as Target on Prometheus Server
Now that we have the node exporter up and running on the server, we have to add this server a target on the Prometheus server configuration.
Note: This configuration should be done on the Prometheus server.
Step 1: Login to the Prometheus server and open the prometheus.yml file.
sudo vi /etc/prometheus/prometheus.ymlStep 2: Under the scrape config section add the node exporter target as shown below. Change 10.142.0.3 with your server IP where you have setup node exporter. Job name can be your server hostname or IP for identification purposes.
- job_name: 'node_exporter_metrics'
  scrape_interval: 5s
  static_configs:
    - targets: ['10.142.0.3:9100']
Step 3: Restart the prometheus service for the configuration changes to take place.
sudo systemctl restart prometheusNow, if you check the target in prometheus web UI (http://<prometheus-IP>:9090/targets) , you will be able to see the status as shown below.

Also, you can use the Prometheus expression browser to query for node related metrics. Following are the few key node metrics you can use to find its statistics.
node_memory_MemFree_bytes node_cpu_seconds_total node_filesystem_avail_bytes rate(node_cpu_seconds_total{mode="system"}[1m]) rate(node_network_receive_bytes_total[1m]) -
INSTALL PHP 7.4
1. Install epel repo and remi repo
# dnf install https://dl.fedoraproject.org/pub/epel/epel-release-latest-8.noarch.rpm -y
# dnf install https://rpms.remirepo.net/enterprise/remi-release-8.rpm -y
2. Check php module list and Install PHP7.4
# dnf module list php
# dnf module enable php:remi-7.4 -y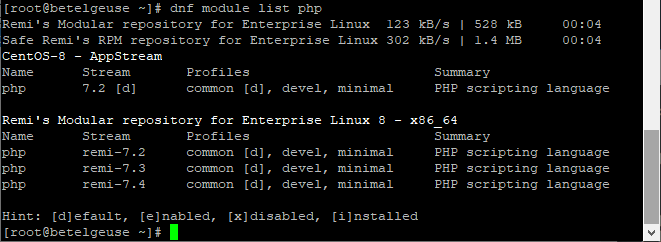
3. Install PHP and the Extensions
# dnf install php php-cli php-common php-json php-xml php-mbstring php-mysqli php-zip php-intlDisable SElinux
1. in order to install PI-Hole you need to disable SElinux
/etc/selinux/config2. reboot the server.
Disable Firewall (optional)
1. Disable the Firewall or configure firewall for Pi-hole.
sudo systemctl stop firewalld
sudo systemctl disable firewalld
INSTALL PI-HOLE
1 . Download Install Pi-hole
# git clone --depth 1 https://github.com/pi-hole/pi-hole.git Pi-hole
# cd "Pi-hole/automated install/"
# sed -i "s/lighttpd\slighttpd-fastcgi//" basic-install.sh
# chmod +x basic-install.sh
# ./basic-install.sh
Setting up Pi-hole as a recursive DNS server solution
sudo dnf install unbound1. backup file /etc/unbound/unbound.conf
mv /etc/unbound/unbound.conf /etc/unbound/unbound.conf.bak3. Create a new unbound.conf file
nano /etc/unbound/unbound.conf4. Add the following line and save.
include: "/etc/unbound/unbound.conf.d/*.conf"5. Create /etc/unbound/unbound.conf.d/pi-hole.conf:
server:
    # If no logfile is specified, syslog is used
    # logfile: "/var/log/unbound/unbound.log"
    verbosity: 0

    interface: 127.0.0.1
    port: 5335
    do-ip4: yes
    do-udp: yes
    do-tcp: yes

    # May be set to yes if you have IPv6 connectivity
    do-ip6: no

    # You want to leave this to no unless you have *native* IPv6. With 6to4 and
    # Terredo tunnels your web browser should favor IPv4 for the same reasons
    prefer-ip6: no

    # Use this only when you downloaded the list of primary root servers!
    # If you use the default dns-root-data package, unbound will find it automatically
    #root-hints: "/var/lib/unbound/root.hints"

    # Trust glue only if it is within the server's authority
    harden-glue: yes

    # Require DNSSEC data for trust-anchored zones, if such data is absent, the zone becomes BOGUS
    harden-dnssec-stripped: yes

    # Don't use Capitalization randomization as it known to cause DNSSEC issues sometimes
    # see https://discourse.pi-hole.net/t/unbound-stubby-or-dnscrypt-proxy/9378 for further details
    use-caps-for-id: no

    # Reduce EDNS reassembly buffer size.
    # IP fragmentation is unreliable on the Internet today, and can cause
    # transmission failures when large DNS messages are sent via UDP. Even
    # when fragmentation does work, it may not be secure; it is theoretically
    # possible to spoof parts of a fragmented DNS message, without easy
    # detection at the receiving end. Recently, there was an excellent study
    # >>> Defragmenting DNS - Determining the optimal maximum UDP response size for DNS <<<
    # by Axel Koolhaas, and Tjeerd Slokker (https://indico.dns-oarc.net/event/36/contributions/776/)
    # in collaboration with NLnet Labs explored DNS using real world data from the
    # the RIPE Atlas probes and the researchers suggested different values for
    # IPv4 and IPv6 and in different scenarios. They advise that servers should
    # be configured to limit DNS messages sent over UDP to a size that will not
    # trigger fragmentation on typical network links. DNS servers can switch
    # from UDP to TCP when a DNS response is too big to fit in this limited
    # buffer size. This value has also been suggested in DNS Flag Day 2020.
    edns-buffer-size: 1232

    # Perform prefetching of close to expired message cache entries
    # This only applies to domains that have been frequently queried
    prefetch: yes

    # One thread should be sufficient, can be increased on beefy machines. In reality for most users running on small networks or on a single machine, it should be unnecessary to seek performance enhancement by increasing num-threads above 1.
    num-threads: 1

    # Ensure kernel buffer is large enough to not lose messages in traffic spikes
    so-rcvbuf: 1m

    # Ensure privacy of local IP ranges
    private-address: 192.168.0.0/16
    private-address: 169.254.0.0/16
    private-address: 172.16.0.0/12
    private-address: 10.0.0.0/8
    private-address: fd00::/8
    private-address: fe80::/10
Start your local recursive server and test that it's operational:
sudo service unbound restart
dig pi-hole.net @127.0.0.1 -p 5335
The first query may be quite slow, but subsequent queries, also to other domains under the same TLD, should be fairly quick.
You should also consider adding
edns-packet-max=1232to a config file like
/etc/dnsmasq.d/99-edns.confto signal FTL to adhere to this limit.Test validation
You can test DNSSEC validation using
dig sigfail.verteiltesysteme.net @127.0.0.1 -p 5335
dig sigok.verteiltesysteme.net @127.0.0.1 -p 5335
The first command should give a status report of
SERVFAILand no IP address. The second should giveNOERRORplus an IP address.Configure Pi-hole
Finally, configure Pi-hole to use your recursive DNS server by specifying
127.0.0.1#5335as the Custom DNS (IPv4):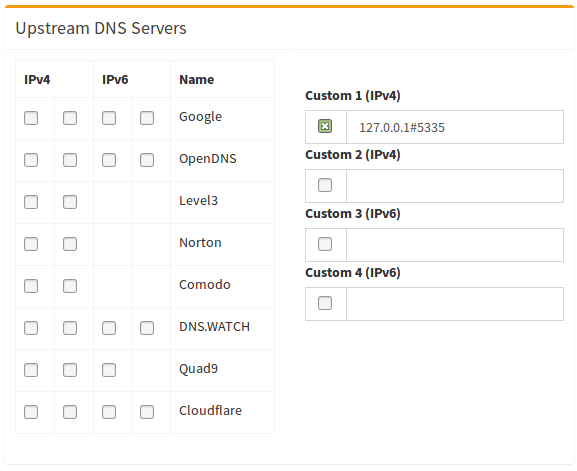
(don't forget to hit Return or click on
Save)Disable
resolvconfforunbound(optional)The
unboundpackage can come with a systemd service calledunbound-resolvconf.serviceand default enabled. It instructsresolvconfto writeunbound's own DNS service atnameserver 127.0.0.1, but without the 5335 port, into the file/etc/resolv.conf. That/etc/resolv.conffile is used by local services/processes to determine DNS servers configured. If you configured/etc/dhcpcd.confwith astatic domain_name_servers=line, these DNS server(s) will be ignored/overruled by this service.To check if this service is enabled for your distribution, run below one and take note of the
Activeline. It will show eitheractiveorinactiveor it might not even be installed resulting in acould not be foundmessage:sudo systemctl status unbound-resolvconf.serviceTo disable the service if so desire, run below two:
sudo systemctl disable unbound-resolvconf.service
sudo systemctl stop unbound-resolvconf.service
To have the
domain_name_servers=in the file/etc/dhcpcd.confactivated/propagate, run below one:sudo systemctl restart dhcpcdAnd check with below one if IP(s) on the
nameserverline(s) reflects the ones in the/etc/dhcpcd.conffile:cat /etc/resolv.confAdd logging to unbound
Warning
It's not recommended to increase verbosity for daily use, as unbound logs a lot. But it might be helpful for debugging purposes.
There are five levels of verbosity
Level 0 means no verbosity, only errors
Level 1 gives operational information
Level 2 gives  detailed operational  information
Level 3 gives query level information
Level 4 gives  algorithm  level  information
Level 5 logs client identification for cache misses
First, specify the log file and the verbosity level in the
serverpart of/etc/unbound/unbound.conf.d/pi-hole.conf:server: # If no logfile is specified, syslog is used logfile: "/var/log/unbound/unbound.log" verbosity: 1Second, create log dir and file, set permissions:
sudo mkdir -p /var/log/unbound
sudo touch /var/log/unbound/unbound.log
sudo chown unbound /var/log/unbound/unbound.log
Third, restart unbound:
sudo service unbound restart -
If the Red Hat Insights site is reflecting a different hostname simply run the following to make the insights-client check back in
# insights-client --version -
Docker is an application that simplifies the process of managing application processes in containers. Containers let you run your applications in resource-isolated processes. They’re similar to virtual machines, but containers are more portable, more resource-friendly, and more dependent on the host operating system.
Prerequisites
To follow this tutorial, you will need the following:
- Ubuntu 20.04 server.
Step 1 — Installing Docker
The Docker installation package available in the official Ubuntu repository may not be the latest version. To ensure we get the latest version, we’ll install Docker from the official Docker repository. To do that, we’ll add a new package source, add the GPG key from Docker to ensure the downloads are valid, and then install the package.
First, update your existing list of packages:
sudo apt updateNext, install a few prerequisite packages that let
aptuse packages over HTTPS:sudo apt install apt-transport-https ca-certificates curl software-properties-commonThen add the GPG key for the official Docker repository to your system:
curl -fsSL https://download.docker.com/linux/ubuntu/gpg | sudo apt-key add -Add the Docker repository to APT sources:
sudo add-apt-repository "deb [arch=amd64] https://download.docker.com/linux/ubuntu focal stable"This will also update our package database with the Docker packages from the newly added repo.
Make sure you are about to install from the Docker repo instead of the default Ubuntu repo:
sudo apt-cache policy docker-ceYou’ll see output like this, although the version number for Docker may be different:
docker-ce:
  Installed: (none)
  Candidate: 5:19.03.9~3-0~ubuntu-focal
  Version table:
     5:19.03.9~3-0~ubuntu-focal 500
        500 https://download.docker.com/linux/ubuntu focal/stable amd64 Packages
Notice that
docker-ceis not installed, but the candidate for installation is from the Docker repository for Ubuntu 20.04 (focal).Finally, install Docker:
sudo apt install docker-ceDocker should now be installed, the daemon started, and the process enabled to start on boot. Check that it’s running:
sudo systemctl status dockerThe output should be similar to the following, showing that the service is active and running:
Output
● docker.service - Docker Application Container Engine
     Loaded: loaded (/lib/systemd/system/docker.service; enabled; vendor preset: enabled)
     Active: active (running) since Tue 2020-05-19 17:00:41 UTC; 17s ago
TriggeredBy: ● docker.socket
       Docs: https://docs.docker.com
   Main PID: 24321 (dockerd)
      Tasks: 8
     Memory: 46.4M
     CGroup: /system.slice/docker.service
             └─24321 /usr/bin/dockerd -H fd:// --containerd=/run/containerd/containerd.sock
Installing Docker now gives you not just the Docker service (daemon) but also the
dockercommand line utility, or the Docker client. We’ll explore how to use thedockercommand later in this tutorial.Step 2 — Executing the Docker Command Without Sudo (Optional)
By default, the
dockercommand can only be run by the root user or by a user in the docker group, which is automatically created during Docker’s installation process. If you attempt to run thedockercommand without prefixing it withsudoor without being in the docker group, you’ll get an output like this:Output docker: Cannot connect to the Docker daemon. Is the docker daemon running on this host?. See 'docker run --help'.If you want to avoid typing
sudowhenever you run thedockercommand, add your username to thedockergroup:sudo usermod -aG docker ${USER}To apply the new group membership, log out of the server and back in, or type the following:
su - ${USER}You will be prompted to enter your user’s password to continue.
Confirm that your user is now added to the docker group by typing:
groupsOutput sammy sudo dockerIf you need to add a user to the
dockergroup that you’re not logged in as, declare that username explicitly using:sudo usermod -aG docker usernameThe rest of this article assumes you are running the
dockercommand as a user in the docker group. If you choose not to, please prepend the commands withsudo. -
Portainer upgrade
If you already have Portainer installed, you’ll need to stop and remove it from your system before you upgrade the container.
To do that, run this command:
sudo docker stop portainer && sudo docker rm portainerYou will probably be prompted for your sudo password. Enter that and then the system will remove the Portainer container, but it will NOT delete your Portainer data as we didn’t remove that.
Next, you’ll want to pull the latest Portainer image:
sudo docker pull portainer/portainer-ce:latestOnce that is done, you’re ready to deploy the newest version of Portainer:
sudo docker run -d -p 9000:9000 -p 8000:8000 --name portainer --restart always -v /var/run/docker.sock:/var/run/docker.sock -v portainer_data:/data portainer/portainer-ce:latestNow you can go to http://your-server-address:9000 and login.
Note:
Doing this will NOT remove your other applications/containers/etc.
-
want to run a cron job that should run a specific shell script /home/jobs/sync.cache.sh every minute. How do I use crontab to execute script every minute on Linux or Unix-like system? How can I run cron job every minute on Ubuntu Linux?
Cron is one of the most useful tool in a Linux or UNIX like operating systems. It is usually used for sysadmin jobs such as backups or cleaning /tmp/ directories and more. Let us see how can we run cron job every one minute on Linux, *BSD and Unix-like systems.
Run cron job every minute
The syntax is:
* * * * * /path/to/your/scriptTo run a script called /home/vivek/bin/foo, type the crontab command:
$ crontab -eAppend the following job:
* * * * * /home/vivek/bin/fooSave and close the file.
How does it work?
The syntax for crontab is as follows:
* * * * * command to be executed
- - - - -
| | | | |
| | | | ----- Day of week (0 - 7) (Sunday=0 or 7)
| | | ------- Month (1 - 12)
| | --------- Day of month (1 - 31)
| ----------- Hour (0 - 23)
------------- Minute (0 - 59)
The asterisk (*) operator specifies all possible values for a field. For example, an asterisk in the hour time field would be equivalent to every hour or an asterisk in the month field would be equivalent to every month. An asterisk in the every field means run given command/script every minute.
A note about using /etc/cron.d/ directory
If you put cronjob in /etc/cron.d/ directory you must provide the username to run the task as in the task definition:
* * * * * USERNAME /path/to/your/scriptFor example, run a script that uses rsync to replicate changed files. Create a file named /etc/crond.d/rsync.job
$ sudo vi /etc/crond.d/rsync.jobAppend the following:
PATH=/sbin:/usr/sbin:/bin:/usr/bin

# Start job every 1 minute
* * * * * root /root/bin/replication.sh

# Another example to set up cron job every 1 minute is a commonly used in cron schedule.
* * * * * root /usr/bin/perl /usr/lib/cgi-bin/check.for.errors.cgi
Save and close the file. Here is a sample /root/bin/replication.sh file:
#!/bin/bash
# Usage: A sample shell script to replicate newly added
# HTML files/images/js etc on all $servers i.e. poor mans
# file replication service ;)
#
# Author: Vivek Gite, under GPL v2.0+
#
# Note: Set ssh pub key based auth to work this script
# ------------------------------------------------------------
_rsync="/usr/bin/rsync"
_rsync_opt='-az -H --delete --numeric-ids --exclude=cache/css --exclude=tmp/js'

# user name for ssh
u="vivek"

# server nodes
servers="node01 node02"

# Source and dest
S='/home/vivek/wwwfiles/'
D='/home/vivek/wwwfiles'

# Let us loop it and do it
for b in ${servers}
do
 ${_rsync} ${_rsync_opt} "$@" ${S} ${u}@${b}:${D}
done
A note about dealing with race condition when running cron job every minute
We are going to use the flock command which manages flock(2) locks from within shell scripts or from the command line. Modify your script as follows to ensure only one instance of a Bash script is running every minute:
#!/bin/bash

## Copyright (C) 2009 Przemyslaw Pawelczyk <przemoc@gmail.com>
##
## This script is licensed under the terms of the MIT license.
## Source https://gist.github.com/przemoc/571091
## https://opensource.org/licenses/MIT
#
# Lockable script boilerplate

### HEADER ###

LOCKFILE="/var/lock/`basename $0`"
LOCKFD=99

# PRIVATE
_lock()             { flock -$1 $LOCKFD; }
_no_more_locking()  { _lock u; _lock xn && rm -f $LOCKFILE; }
_prepare_locking()  { eval "exec $LOCKFD>\"$LOCKFILE\""; trap _no_more_locking EXIT; }

# ON START
_prepare_locking

# PUBLIC
exlock_now()        { _lock xn; }  # obtain an exclusive lock immediately or fail
exlock()            { _lock x; }   # obtain an exclusive lock
shlock()            { _lock s; }   # obtain a shared lock
unlock()            { _lock u; }   # drop a lock

# Simplest example is avoiding running multiple instances of script.
exlock_now || exit 1

### BEGIN OF SCRIPT ###
_rsync="/usr/bin/rsync"
_rsync_opt='-az -H --delete --numeric-ids --exclude=cache/css --exclude=tmp/js'

# user name for ssh
u="vivek"

# server nodes
servers="node01 node02"

# Source and dest
S='/home/vivek/wwwfiles/'
D='/home/vivek/wwwfiles'

# Let us loop it and do it
for b in ${servers}
do
 ${_rsync} ${_rsync_opt} "$@" ${S} ${u}@${b}:${D}
done
### END OF SCRIPT ###


# Remember! Lock file is removed when one of the scripts exits and it is
#           the only script holding the lock or lock is not acquired at all.
-
First, we will download the Node Exporter on all machines :
check the download version available from here.
wget https://github.com/prometheus/node_exporter/releases/download/v1.2.2/node_exporter-1.2.2.linux-amd64.tar.gzExtract the downloaded archive
tar -xf node_exporter-1.2.2.linux-amd64.tar.gzMove the node_exporter binary to
/usr/local/bin:sudo mv node_exporter-1.2.2.linux-amd64/node_exporter /usr/local/binRemove the residual files with:
rm -r node_exporter-1.2.2.linux-amd64*Next, we will create users and service files for node_exporter.
For security reasons, it is always recommended to run any services/daemons in separate accounts of their own. Thus, we are going to create an user account for node_exporter. We have used the
-rflag to indicate it is a system account, and set the default shell to/bin/falseusing-sto prevent logins.sudo useradd -rs /bin/false node_exporterThen, we will create a systemd unit file so that node_exporter can be started at boot.
sudo nano /etc/systemd/system/node_exporter.service[Unit] Description=Node Exporter After=network.target [Service] User=node_exporter Group=node_exporter Type=simple ExecStart=/usr/local/bin/node_exporter [Install] WantedBy=multi-user.targetSince we have created a new unit file, we must reload the systemd daemon, set the service to always run at boot and start it :
sudo systemctl daemon-reload
sudo systemctl enable node_exporter
sudo systemctl start node_exporter
sudo systemctl status node_exporter
Configure UFW / Firewall Ubuntu :
sudo ufw allow from 10.0.0.46 to any port 9100 sudo ufw status numbered -
Prometheus is an open-source system and service monitoring and alerting tool used for recording real-time services and collecting metrics in a time-series database. It s written in Go and licensed under the Apache 2 License originally developed by SoundCloud.In this tutorial, we will show you how to install Prometheus on Ubuntu 20.04 server, which can be done easily if you follow it step by step
Requirements:
- For the purposes of this tutorial, we will use an Ubuntu20.04 VPS.
- Access to the root user account (or a user with sudo privileges)
Step 1: Log in to the Server & Update the Server OS Packages
First, log in to your Ubuntu 20.04 server via SSH as the root use
ssh root@IP_ADDRESS -p PORT_NUMBERDon’t forget to replace IP_Address and Port_Number with your server’s actual IP address and the SSH port number. Also, you should replace ‘root’ with the username of the admin account if needed.
Once you are in, run the following commands to update the package index and upgrade all installed packages to the latest available version.
apt-get update
apt-get upgrade
Step 2. Creating Prometheus System Users and Directory
The Prometheus server requires a service user account to run. You can name your user however you like, but we will create a user named
prometheus. This user will be a system user (-r) who will be unable to get a shell (-s /bin/false)useradd --no-create-home -rs /bin/false prometheusAlso, we need to create directories for configuration files and other Prometheus data.
mkdir /etc/prometheus
mkdir /var/lib/prometheus
Now we will have to update the group and user ownership on the newly created directories.
chown prometheus:prometheus /etc/prometheuschown prometheus:prometheus /var/lib/prometheusStep 3. Download Prometheus Binary File
Prometheus is included by default on the Ubuntu 20.04 repositories.
apt-cache policy prometheusprometheus: Installed: (none) Candidate: 2.15.2+ds-2 Version table: 2.15.2+ds-2 500 500 http://us.archive.ubuntu.com/ubuntu focal/universe amd64 PackagesHowever, the Prometheus release version provided by the default Ubuntu repositories may not be up-to-date. At the time of writing this article, the latest stable version of Prometheus is 2.30.3.
But before downloading, visit the official Prometheus downloads page and check if there is a new version available.
You can download it using the following command:
wget https://github.com/prometheus/prometheus/releases/download/v2.30.3/prometheus-2.30.3.linux-amd64.tar.gzOnce the tarball is downloaded, verify the tarball checksum with the following command:
sha256sum prometheus-2.30.3.linux-amd64.tar.gzYou should see an output that looks similar to the one below:
1ccd386d05f73a98b69aa5e0ed31fffac95cd9dadf7df1540daf2f182c5287e2 prometheus-2.30.3.linux-amd64.tar.gzCompare the hash value from the above output to the checksum value on the Prometheus download page. If they match, that means the file’s integrity is validated.
Now you have successfully downloaded the Prometheus file and now you will extract it to the
/optdirectory using the tar command:tar xvzf prometheus-2.30.3.linux-amd64.tar.gz -C /optNext, you need to copy the binary files to
/usr/local/bindirectory and fix the permissions. This is done with the following commands:mv /opt/prometheus-2.30.3.linux-amd64/prometheus /opt/prometheus-2.30.3.linux-amd64/promtool /usr/local/bin/ chown prometheus:prometheus /usr/local/bin/prometheus /usr/local/bin/promtoolAlso, we need to copy the
consolesandconsole_librariesdirectories to Prometheus configuration directory,/etc/prometheusmv /opt/prometheus-2.30.3.linux-amd64/consoles /opt/prometheus-2.30.3.linux-amd64/console_libraries /etc/prometheus/ chown -R prometheus:prometheus /etc/prometheus/consoles /etc/prometheus/console_librariesStep 4: Create Prometheus Configuration file
Prometheus configuration file has been prepared and available on the extracted archive folder, and you need just to copy it to the Prometheus configuration
/etc/prometheusdirectory.mv /opt/prometheus-2.30.3.linux-amd64/prometheus.yml /etc/prometheus/prometheus.yml chown prometheus:prometheus /etc/prometheus/prometheus.ymlThe content of the
prometheus.ymlfile:# my global config global: scrape_interval: 15s # Set the scrape interval to every 15 seconds. Default is every 1 minute. evaluation_interval: 15s # Evaluate rules every 15 seconds. The default is every 1 minute. # scrape_timeout is set to the global default (10s). # Alertmanager configuration alerting: alertmanagers: - static_configs: - targets: # - alertmanager:9093 # Load rules once and periodically evaluate them according to the global 'evaluation_interval'. rule_files: # - "first_rules.yml" # - "second_rules.yml" # A scrape configuration containing exactly one endpoint to scrape: # Here it's Prometheus itself. scrape_configs: # The job name is added as a label `job=<job_name>` to any timeseries scraped from this config. - job_name: "prometheus" # metrics_path defaults to '/metrics' # scheme defaults to 'http'. static_configs: - targets: ["localhost:9090"]
The configuration is set up to scrape every 15 seconds and Prometheus listens on port
9090.Linux server scrape example:
global:
  scrape_interval: 1s

scrape_configs:
  - job_name: 'prometheus'
    scrape_interval: 5s
    static_configs:
      - targets: ['prometheus.linux-network.home:9090']
      - targets: ['plex.linux-network.home:9100']
      - targets: ['grafana.linux-network.home:9100']
      - targets: ['NS1.linux-network.home:9100']
      - targets: ['NS2.linux-network.home:9100']
      - targets: ['WEB1.linux-network.home:9100']
      - targets: ['DB1.linux-network.home:9100']
      - targets: ['PVE2.linux-network.home:9100']
Step 5: Create Prometheus Systemd Service file
Now we need to create a system service file.
nano /etc/systemd/system/prometheus.serviceIn that file, add the following content:
[Unit]
Description=Prometheus
Wants=network-online.target
After=network-online.target

[Service]
User=prometheus
Group=prometheus
Type=simple
ExecStart=/usr/local/bin/prometheus \
    --config.file /etc/prometheus/prometheus.yml \
    --storage.tsdb.path /var/lib/prometheus/ \
    --web.console.templates=/etc/prometheus/consoles \
    --web.console.libraries=/etc/prometheus/console_libraries

[Install]
WantedBy=multi-user.target
After adding the content save and close the file.
To use the newly created service you will have to reload the daemon services, Use the below command to reload daemon services.
systemctl daemon-reloadYou can now start and enable Prometheus service using the below commands:
systemctl start prometheussystemctl enable prometheusTo check and verify the status of your Prometheus service, run the following command:
systemctl status prometheusOutput :
● prometheus.service - Prometheus
Loaded: loaded (/etc/systemd/system/prometheus.service; enabled; vendor preset: enabled)
Active: active (running) since Sat 2021-10-23 19:15:21 UTC; 4s ago
Main PID: 9884 (prometheus)
Tasks: 1 (limit: 2245)
Memory: 336.0K
CGroup: /system.slice/prometheus.service
└─9884 /usr/local/bin/prometheus --config.file /etc/prometheus/prometheus.yml --storage.tsdb.path /var/lib/prometheus/ --web.console.templates=/etc/prometheus/consoles --web.console.libraries=/etc/prometheus/console_libraries
Prometheus installation and configuration is set up, You can see status Active: active(running)
Now Prometheus service is up and running and you can access it from any web browser.
http://Your_server_IP:9090
To check the status of your node, go to Status > Targets.

That’s it! The installation of Prometheus on Ubuntu 20.04 has been completed.
-
Windows users are used to creating shortcuts to have fast access to their files and folders. This is is especially useful when these are buried deep in their system. This feature isn't as obvious on most Linux systems as it is on Windows.
Create a shortcut on a Unix-like operating system using a symlink.
Create Symlink in Linux
Terminal way (the link will appear in the folder the terminal points to):
ln -s /folderorfile/link/will/point/to /name/of/the/link -
Installing CIFS Utilities Packages
To mount a Windows share on a Linux system, first you need to install the CIFS utilities package.
- Installing CIFS utilities on CentOS and Fedora:
sudo dnf install cifs-utilsAuto Mounting
sudo nano /etc/fstab- Add the following line to the file:
# <file system>             <dir>          <type> <options>                                                   <dump>  <pass>
//WIN_SHARE_IP/share_name  /mnt/win_share  cifs  credentials=/etc/win-credentials,file_mode=0755,dir_mode=0755 0       0
Run the following command to mount the share:
mount -aCreating Credential File
For better security it is recommended to use a credentials file, which contains the share username, password and domain.
/etc/win-credentialsThe credentials file has the following format:
username = user
password = password
domain = domain
The file must not be readable by users. To set the correct permissions and ownership run:
sudo chown root: /etc/win-credentials
sudo chmod 600 /etc/win-credentials
Create Symlink in Linux
8. Create a shortcut to your new mounted file share:
Terminal way (the link will appear in the folder the terminal points to):
ln -s /folderorfile/link/will/point/to /name/of/the/link -
How to Import and Export Databases
Export
To Export a database, open up terminal, making sure that you are not logged into MySQL and type,
mysqldump -u [username] -p [database name] > [database name].sqlThe database that you selected in the command will now be exported to your droplet.
Import
To import a database, first create a new blank database in the MySQL shell to serve as a destination for your data.
CREATE DATABASE newdatabase;Then log out of the MySQL shell and type the following on the command line:
mysql -u [username] -p newdatabase < [database name].sqlWith that, your chosen database has been imported into your destination database in MySQL.
Create a database user
login to mysql
mysql -u root -prun the following command
mysql> CREATE USER 'newuser'@'localhost' IDENTIFIED BY 'user_password';Replace
newuserwith the new user name, anduser_passwordwith the user password.Grant Privileges to a MySQL User Account
-
ALL PRIVILEGES– Grants all privileges to a user account. -
CREATE– The user account is allowed to create databases and tables. -
DROP- The user account is allowed to drop databases and tables. -
DELETE- The user account is allowed to delete rows from a specific table. -
INSERT- The user account is allowed to insert rows into a specific table. -
SELECT– The user account is allowed to read a database. -
UPDATE- The user account is allowed to update table rows.
To grant specific privileges to a user account, use the following syntax:
-
Grand all privileges to a user account over a specific database:
mysql> GRANT ALL PRIVILEGES ON database_name.* TO 'database_user'@'localhost'; -
Grand all privileges to a user account on all databases:
mysql> GRANT ALL PRIVILEGES ON *.* TO 'database_user'@'localhost'; -
Grand all privileges to a user account over a specific table from a database:
mysql> GRANT ALL PRIVILEGES ON database_name.table_name TO 'database_user'@'localhost'; -
Grant multiple privileges to a user account over a specific database:
mysql> GRANT SELECT, INSERT, DELETE ON database_name.* TO database_user@'localhost';Display MySQL User Account Privileges
To find the privilege(s) granted to a specific MySQL user account, use the
SHOW GRANTSstatement:mysql> SHOW GRANTS FOR 'database_user'@'localhost';The output will look something like below:
+---------------------------------------------------------------------------+
| Grants for database_user@localhost                                       |
+---------------------------------------------------------------------------+
| GRANT USAGE ON *.* TO 'database_user'@'localhost'                        |
| GRANT ALL PRIVILEGES ON `database_name`.* TO 'database_user'@'localhost' |
+---------------------------------------------------------------------------+
2 rows in set (0.00 sec)
Revoke Privileges from a MySQL User Account
The syntax to revoke one or more privileges from a user account is almost identical as when granting privileges.
To revoke all privileges from a user account over a specific database, run the following command:
mysql> REVOKE ALL PRIVILEGES ON database_name.* FROM 'database_user'@'localhost';Remove an Existing MySQL User Account
To delete a MySQL user account use the
DROP USERstatement:mysql> DROP USER 'user'@'localhost'
-
-
Security Enhanced Linux or SELinux is a security mechanism built into the Linux kernel used by RHEL-based distributions.
SELinux adds an additional layer of security to the system by allowing administrators and users to control access to objects based on policy rules.
SELinux policy rules specify how processes and users interact with each other as well as how processes and users interact with files. When there is no rule explicitly allowing access to an object, such as for a process opening a file, access is denied.
SELinux has three modes of operation:
- Enforcing: SELinux allows access based on SELinux policy rules.
- Permissive: SELinux only logs actions that would have been denied if running in enforcing mode. This mode is useful for debugging and creating new policy rules.
- Disabled: No SELinux policy is loaded, and no messages are logged.
By default, in CentOS 8, SELinux is enabled and in enforcing mode. It is highly recommended to keep SELinux in enforcing mode. However, sometimes it may interfere with the functioning of some application, and you need to set it to the permissive mode or disable it completely.
In this tutorial, we will explain to disable SELinux on CentOS 8.
Prerequisites
Only the root user or a user with sudo privileges can change the SELinux mode.
Checking the SELinux Mode
Use the
sestatuscommand to check the status and the mode in which SELinux is running:sestatusSELinux status: enabled SELinuxfs mount: /sys/fs/selinux SELinux root directory: /etc/selinux Loaded policy name: targeted Current mode: enforcing Mode from config file: enforcing Policy MLS status: enabled Policy deny_unknown status: allowed Memory protection checking: actual (secure) Max kernel policy version: 31The output above shows that SELinux is enabled and set to enforcing mode.
Changing SELinux Mode to Permissive
When enabled, SELinux can be either in enforcing or permissive mode. You can temporarily change the mode from targeted to permissive with the following command:
sudo setenforce 0However, this change is valid for the current runtime session only and do not persist between reboots.
To permanently set the SELinux mode to permissive, follow the steps below:
-
Open the
/etc/selinux/configfile and set theSELINUXmod topermissive:
/etc/selinux/config-
# This file controls the state of SELinux on the system. # SELINUX= can take one of these three values: # enforcing - SELinux security policy is enforced. # permissive - SELinux prints warnings instead of enforcing. # disabled - No SELinux policy is loaded. SELINUX=permissive # SELINUXTYPE= can take one of these three values: # targeted - Targeted processes are protected, # minimum - Modification of targeted policy. Only selected processes are protected. # mls - Multi Level Security protection. SELINUXTYPE=targeted -
Save the file and run the
setenforce 0command to change the SELinux mode for the current session:sudo shutdown -r now
Disabling SELinux
Instead of disabling SELinux, it is strongly recommended to change the mode to permissive. Disable SELinux only when required for the proper functioning of your application.
Perform the steps below to disable SELinux on your CentOS 8 system permanently:
Open the
/etc/selinux/configfile and change theSELINUXvalue todisabled:/etc/selinux/config# This file controls the state of SELinux on the system. # SELINUX= can take one of these three values: # enforcing - SELinux security policy is enforced. # permissive - SELinux prints warnings instead of enforcing. # disabled - No SELinux policy is loaded. SELINUX=disabled # SELINUXTYPE= can take one of these three values: # targeted - Targeted processes are protected, # minimum - Modification of targeted policy. Only selected processes are protected. # mls - Multi Level Security protection. SELINUXTYPE=targeted-
Save the file and reboot the system:
sudo shutdown -r now -
When the system is booted, use the
sestatuscommand to verify that SELinux has been disabled:sestatusThe output should look like this:
SELinux status: disabled
Conclusion
SELinux is a mechanism to secure a system by implementing mandatory access control (MAC). SELinux is enabled by default on CentOS 8 systems, but it can be disabled by editing the configuration file and rebooting the system.
To learn more about the powerful features of SELinux, visit the CentOS SELinux guide.
-
Introduction
The Apache HTTP server is the most widely-used web server in the world. It provides many powerful features including dynamically loadable modules, robust media support, and extensive integration with other popular software.
In this guide, you will install an Apache web server with virtual hosts on your CentOS 8 server.
Prerequisites
You will need the following to complete this guide:
- A non-root user with sudo privileges configured on your server.
- Ensure that a basic firewall is configured.
Step 1 — Installing Apache
Apache is available within CentOS’s default software repositories, which means you can install it with the
dnfpackage manager.As the non-root sudo user configured in the prerequisites, install the Apache package:
sudo dnf install httpdAfter confirming the installation,
dnfwill install Apache and all required dependencies.If you also plan to configure Apache to serve content over HTTPS, you will also want to open up port
443by enabling thehttpsservice:sudo firewall-cmd --permanent --add-service=http sudo firewall-cmd --permanent --add-service=httpsNext, reload the firewall to put these new rules into effect:
sudo firewall-cmd --reloadAfter the firewall reloads, you are ready to start the service and check the web server.
Step 2 — Checking your Web Server
Apache does not automatically start on CentOS once the installation completes, so you will need to start the Apache process manually:
sudo systemctl start httpdVerify that the service is running with the following command:
sudo systemctl status httpdYou will receive an
activestatus when the service is running:Output● httpd.service - The Apache HTTP Server Loaded: loaded (/usr/lib/systemd/system/httpd.service; disabled; vendor preset: disa> Active: active (running) since Thu 2020-04-23 22:25:33 UTC; 11s ago Docs: man:httpd.service(8) Main PID: 14219 (httpd) Status: "Running, listening on: port 80" Tasks: 213 (limit: 5059) Memory: 24.9M CGroup: /system.slice/httpd.service ├─14219 /usr/sbin/httpd -DFOREGROUND ├─14220 /usr/sbin/httpd -DFOREGROUND ├─14221 /usr/sbin/httpd -DFOREGROUND ├─14222 /usr/sbin/httpd -DFOREGROUND └─14223 /usr/sbin/httpd -DFOREGROUND ...As this output indicates, the service has started successfully. However, the best way to test this is to request a page from Apache.
You can access the default Apache landing page to confirm that the software is running properly through your IP address. If you do not know your server’s IP address, you can get it a few different ways from the command line.
Type
qto return to the command prompt and then type:hostname -IThis command will display all of the host’s network addresses, so you will get back a few IP addresses separated by spaces. You can try each in your web browser to determine whether they work.
Alternatively, you can use
curlto request your IP fromicanhazip.com, which will give you your public IPv4 address as read from another location on the internet:curl -4 icanhazip.comWhen you have your server’s IP address, enter it into your browser’s address bar:
http://your_server_ipYou’ll see the default CentOS 8 Apache web page:

This page indicates that Apache is working correctly. It also includes some basic information about important Apache files and directory locations.
Step 3 — Managing the Apache Process
Now that the service is installed and running, you can now use different systemctl commands to manage the service.
To stop your web server, type:
sudo systemctl stop httpdTo start the web server when it is stopped, type:
sudo systemctl start httpdTo stop and then start the service again, type:
sudo systemctl restart httpdIf you are simply making configuration changes, Apache can often reload without dropping connections. To do this, use this command:
sudo systemctl reload httpdBy default, Apache is configured to start automatically when the server boots. If this is not what you want, disable this behavior by typing:
sudo systemctl disable httpdTo re-enable the service to start up at boot, type:
sudo systemctl enable httpdApache will now start automatically when the server boots again.
The default configuration for Apache will allow your server to host a single website. If you plan on hosting multiple domains on your server, you will need to configure virtual hosts on your Apache web server.
Step 4 — Setting Up Virtual Hosts (Recommended)
When using the Apache web server, you can use virtual hosts (if you are more familiar with Nginx, these are similar to server blocks) to encapsulate configuration details and host more than one domain from a single server. In this step, you will set up a domain called
example.com, but you should replace this with your own domain name.Apache on CentOS 8 has one virtual host enabled by default that is configured to serve documents from the
/var/www/htmldirectory. While this works well for a single site, it can become unwieldy if you are hosting multiple sites. Instead of modifying/var/www/html, you will create a directory structure within/var/wwwfor theexample.comsite, leaving/var/www/htmlin place as the default directory to be served if a client request doesn’t match any other sites.Create the
htmldirectory forexample.comas follows, using the-pflag to create any necessary parent directories:sudo mkdir -p /var/www/example.com/htmlCreate an additional directory to store log files for the site:
sudo mkdir -p /var/www/example.com/logNext, assign ownership of the
htmldirectory with the$USERenvironmental variable:sudo chown -R $USER:$USER /var/www/example.com/htmlMake sure that your web root has the default permissions set:
sudo chmod -R 755 /var/wwwNext, create a sample
index.htmlpage usingvior your favorite editor:sudo vi /var/www/example.com/html/index.htmlPress
ito switch toINSERTmode and add the following sample HTML to the file:/var/www/example.com/html/index.html<html> <head> <title>Welcome to Example.com!</title> </head> <body> <h1>Success! The example.com virtual host is working!</h1> </body> </html>Save and close the file by pressing
ESC, typing:wq, and pressingENTER.With your site directory and sample index file in place, you are almost ready to create the virtual host files. Virtual host files specify the configuration of your separate sites and tell the Apache web server how to respond to various domain requests.
Before you create your virtual hosts, you will need to create a
sites-availabledirectory to store them in. You will also create thesites-enableddirectory that tells Apache that a virtual host is ready to serve to visitors. Thesites-enableddirectory will hold symbolic links to virtual hosts that we want to publish. Create both directories with the following command:sudo mkdir /etc/httpd/sites-available /etc/httpd/sites-enabledNext, you will tell Apache to look for virtual hosts in the
sites-enableddirectory. To accomplish this, edit Apache’s main configuration file using vi or your favorite text editor and add a line declaring an optional directory for additional configuration files:sudo vi /etc/httpd/conf/httpd.confPress capital
Gto navigate towards the end of the file. Then pressito switch toINSERTmode and add the following line to the very end of the file:/etc/httpd/conf/httpd.conf... # Supplemental configuration # # Load config files in the "/etc/httpd/conf.d" directory, if any. IncludeOptional conf.d/*.conf IncludeOptional sites-enabled/*.confSave and close the file when you are done adding that line. Now that you have your virtual host directories in place, you will create your virtual host file.
Start by creating a new file in the
sites-availabledirectory:sudo vi /etc/httpd/sites-available/example.com.confAdd in the following configuration block, and change the
example.comdomain to your domain name:/etc/httpd/sites-available/example.com.conf<VirtualHost *:80> ServerName www.example.com ServerAlias example.com DocumentRoot /var/www/example.com/html ErrorLog /var/www/example.com/log/error.log CustomLog /var/www/example.com/log/requests.log combined </VirtualHost>This will tell Apache where to find the root directly that holds the publicly accessible web documents. It also tells Apache where to store error and request logs for this particular site.
Save and close the file when you are finished.
Now that you have created the virtual host files, you will enable them so that Apache knows to serve them to visitors. To do this, create a symbolic link for each virtual host in the
sites-enableddirectory:sudo ln -s /etc/httpd/sites-available/example.com.conf /etc/httpd/sites-enabled/example.com.confYour virtual host is now configured and ready to serve content. Before restarting the Apache service, let’s make sure that SELinux has the correct policies in place for your virtual hosts.
Step 5 — Adjusting SELinux Permissions for Virtual Hosts (Recommended)
SELinux is a Linux kernel security module that brings heightened security for Linux systems. CentOS 8 comes equipped with SELinux configured to work with the default Apache configuration. Since you changed the default configuration by setting up a custom log directory in the virtual hosts configuration file, you will receive an error if you attempt to start the Apache service. To resolve this, you need to update the SELinux policies to allow Apache to write to the necessary files.
There are different ways to set policies based on your environment’s needs as SELinux allows you to customize your security level. This step will cover two methods of adjusting Apache policies: universally and on a specific directory. Adjusting policies on directories is more secure, and is therefore the recommended approach.
Adjusting Apache Policies Universally
Setting the Apache policy universally will tell SELinux to treat all Apache processes identically by using the
httpd_unifiedBoolean. While this approach is more convenient, it will not give you the same level of control as an approach that focuses on a file or directory policy.Run the following command to set a universal Apache policy:
sudo setsebool -P httpd_unified 1The
setseboolcommand changes SELinux Boolean values. The-Pflag will update the boot-time value, making this change persist across reboots.httpd_unifiedis the Boolean that will tell SELinux to treat all Apache processes as the same type, so you enabled it with a value of1.Adjusting Apache Policies on a Directory
Individually setting SELinux permissions for the
/var/www/example.com/logdirectory will give you more control over your Apache policies, but may also require more maintenance. Since this option is not universally setting policies, you will need to manually set the context type for any new log directories specified in your virtual host configurations.First, check the context type that SELinux gave the
/var/www/example.com/logdirectory:sudo ls -dlZ /var/www/example.com/log/This command lists and prints the SELinux context of the directory. You will receive output similar to the following:
Outputdrwxr-xr-x. 2 root root unconfined_u:object_r:httpd_sys_content_t:s0 6 Apr 23 23:51 /var/www/example.com/log/The current context is
httpd_sys_content_t, which tells SELinux that the Apache process can only read files created in this directory. In this tutorial, you will change the context type of the/var/www/example.com/logdirectory tohttpd_log_t. This type will allow Apache to generate and append to web application log files:sudo semanage fcontext -a -t httpd_log_t "/var/www/example.com/log(/.*)?"Next, use the
restoreconcommand to apply these changes and have them persist across reboots:sudo restorecon -R -v /var/www/example.com/logThe
-Rflag runs this command recursively, meaning it will update any existing files to use the new context. The-vflag will print the context changes the command made. You will receive the following output confirming the changes:OutputRelabeled /var/www/example.com/log from unconfined_u:object_r:httpd_sys_content_t:s0 to unconfined_u:object_r:httpd_log_t:s0You can list the contexts once more to see the changes:
sudo ls -dlZ /var/www/example.com/log/The output reflects the updated context type:
Outputdrwxr-xr-x. 2 root root unconfined_u:object_r:httpd_log_t:s0 6 Apr 23 23:51 /var/www/example.com/log/Now that the
/var/www/example.com/logdirectory is using thehttpd_log_ttype, you are ready to test your virtual host configuration.Step 6 — Testing the Virtual Host (Recommended)
Once the SELinux context has been updated with either method, Apache will be able to write to the
/var/www/example.com/logdirectory. You can now successfully restart the Apache service:sudo systemctl restart httpdList the contents of the
/var/www/example.com/logdirectory to see if Apache created the log files:ls -lZ /var/www/example.com/logYou’ll receive confirmation that Apache was able to create the
error.logandrequests.logfiles specified in the virtual host configuration:Output-rw-r--r--. 1 root root system_u:object_r:httpd_log_t:s0 0 Apr 24 00:06 error.log -rw-r--r--. 1 root root system_u:object_r:httpd_log_t:s0 0 Apr 24 00:06 requests.logNow that you have your virtual host set up and SELinux permissions updated, Apache will now serve your domain name. You can test this by navigating to
http://example.com, where you should see something like this:
This confirms that your virtual host is successfully configured and serving content. Repeat Steps 4 and 5 to create new virtual hosts with SELinux permissions for additional domains.
-
To mount a windows share on Ubuntu Server:
1. Share the folder on your windows box
2. Create a mount point in /mnt:
sudo mkdir /mnt/windows-share3. Install CIFS-UTILS
sudo apt-get install cifs-utils4. Create a credential file for the windows share. **(You can name the credential file anything you want)**
sudo nano /etc/cifs-credentials5.
username=username
password=password
domain=example.com
6. On your Ubuntu server open the file:
sudo nano /etc/fstabedit the file with your information
//WIN_SHARE_IP/share_name /mnt/win_share cifs credentials=/etc/win-credentials,file_mode=0755,dir_mode=0755 0 07. Run to mount the share:
sudo mount -aCreate Symlink in Linux
8. Create a shortcut to your new mounted file share: (Article here)
Terminal way (the link will appear in the folder the terminal points to):
ln -s /folderorfile/link/will/point/to /name/of/the/link -
Configure static IP address using Netplan
Netplan network configuration had been first introduced to Ubuntu 18.04 LTS Bionic Beaver. It is available to all new Ubuntu 18.04 installations.
Ubuntu ServerTo configure a static IP address on your Ubuntu 20.04 server you need to modify a relevant netplan network configuration file within
/etc/netplan/directory.
This static configuration has been depreciatednetwork: ethernets: enp0s3: addresses: [192.168.1.3/24] gateway4: 192.168.1.1 nameservers: addresses: [4.2.2.2, 8.8.8.8] version: 2This is the new static configuration.
network:
  ethernets:
    enp0s3:
      addresses: [192.168.1.3/24]
      routes:
        - to: default
          via: 192.168.1.99
      nameservers:
        addresses: [4.2.2.2, 8.8.8.8]
  version: 2
Once ready apply changes with:
$ sudo netplan apply
In case you run into some issues execute:
$ sudo netplan --debug apply
-
Tautulli will be installed to
/opt/Tautulli.- Open a terminal
- Install Git
Ubuntu/Debian:
sudo apt-get install git-coreFedora:
sudo yum install git- Install prerequisites:
-
Ubuntu/Debian:
sudo apt-get install python python-setuptools tzdata -
Fedora:
sudo yum install python python2-setuptools -
Type:
cd /opt -
Type:
sudo git clone https://github.com/Tautulli/Tautulli.git -
Optional:
-
Ubuntu/Debian:
sudo addgroup tautulli && sudo adduser --system --no-create-home tautulli --ingroup tautulli -
CentOS/Fedora:
sudo adduser --system --no-create-home tautulli -
sudo chown tautulli:tautulli -R /opt/Tautulli
-
Ubuntu/Debian:
-
Type:
cd Tautulli - to start Tautulli
-
Type:
python Tautulli.py - Tautulli will be loaded in your browser or listening on http://localhost:8181
- To run Tautulli in the background on startup:
# Tautulli - Stats for Plex Media Server usage # # Service Unit file for systemd system manager # # INSTALLATION NOTES # # 1. Copy this file into your systemd service unit directory (often '/lib/systemd/system') # and name it 'tautulli.service' with the following command: # sudo cp /opt/Tautulli/init-scripts/init.systemd /lib/systemd/system/tautulli.service # # 2. Edit the new tautulli.service file with configuration settings as required. # More details in the "CONFIGURATION NOTES" section shown below. # # 3. Enable boot-time autostart with the following commands: # sudo systemctl daemon-reload # sudo systemctl enable tautulli.service # # 4. Start now with the following command: # sudo systemctl start tautulli.service # # CONFIGURATION NOTES # # - The example settings in this file assume that you will run Tautulli as user: tautulli # - The example settings in this file assume that Tautulli is installed to: /opt/Tautulli # # - To create this user and give it ownership of the Tautulli directory: # Ubuntu/Debian: sudo addgroup tautulli && sudo adduser --system --no-create-home tautulli --ingroup tautulli # CentOS/Fedora: sudo adduser --system --no-create-home tautulli # sudo chown tautulli:tautulli -R /opt/Tautulli # # - Adjust ExecStart= to point to: # 1. Your Tautulli executable # - Default: /opt/Tautulli/Tautulli.py # 2. Your config file (recommended is to put it somewhere in /etc) # - Default: --config /opt/Tautulli/config.ini # 3. Your datadir (recommended is to NOT put it in your Tautulli exec dir) # - Default: --datadir /opt/Tautulli # # - Adjust User= and Group= to the user/group you want Tautulli to run as. # # - WantedBy= specifies which target (i.e. runlevel) to start Tautulli for. # multi-user.target equates to runlevel 3 (multi-user text mode) # graphical.target equates to runlevel 5 (multi-user X11 graphical mode) [Unit] Description=Tautulli - Stats for Plex Media Server usage Wants=network-online.target After=network-online.target [Service] ExecStart=/opt/Tautulli/Tautulli.py --config /opt/Tautulli/config.ini --datadir /opt/Tautulli --quiet --daemon --nolaunch GuessMainPID=no Type=forking User=tautulli Group=tautulli [Install] WantedBy=multi-user.target -
Hot to install Glances
sudo apt-get install python-pip build-essential python-dev lm-sensors
sudo pip install psutil logutils bottle batinfo https://bitbucket.org/gleb_zhulik/py3sensors/get/tip.tar.gz zeroconf netifaces pymdstat influxdb elasticsearch potsdb statsd pystache docker-py pysnmp pika py-cpuinfo bernhard
sudo pip install glances
Basic usage
To start
glancessimply typeglancesin terminal.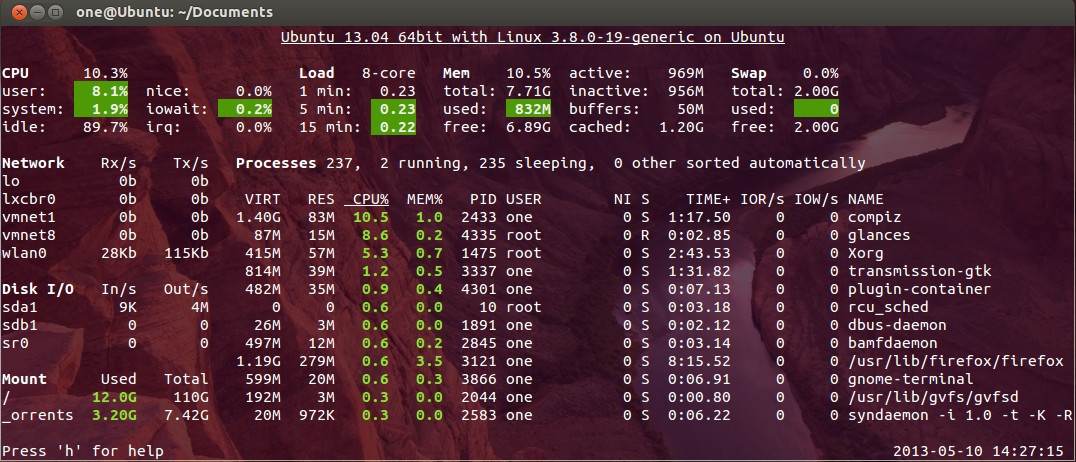
In glances you’ll see a lot of information about the resources of your system: CPU, Load, Memory, Swap Network, Disk I/O and Processes all in one page, by default the color code means:
GREEN : the statistic is “OK”
BLUE : the statistic is “CAREFUL” (to watch)
VIOLET : the statistic is “WARNING” (alert)
RED : the statistic is “CRITICAL” (critical)
When Glances is running, you can press some special keys to give commands to it:
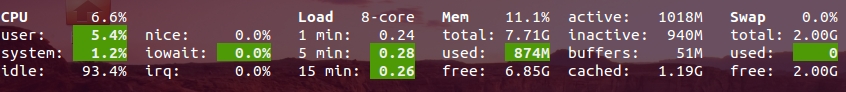
c: Sort processes by CPU%
m: Sort processes by MEM%
p: Sort processes by name
i: Sort processes by IO Rate
d: Show/hide disk I/O stats
f: Show/hide file system stats
n: Show/hide network stats
s: Show/hide sensors stats
b: Bit/s or Byte/s for network IO
w: Delete warning logs
x: Delete warning and critical logs
1: Global CPU or Per Core stats
h: Show/hide this help message
q: Quit (Esc and Ctrl-C also work)
l: Show/hide log messages
Cpu , Ram , Swap Monitoring


Can't remove VM's from ProxMox
in Server
Posted
If you remove a server and it errors saying storage "images" or what ever you name your storage doesn't exist. do the following.